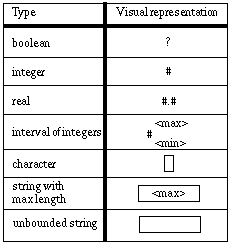
Figure 1: Simple data types
Many visual languages only support data of pre-defined types. For fine-grain general-purpose visual languages based on the data-flow paradigm, there is the need to describe various data structures that will represent the structure of the data that flows in various parts of a graph. In this paper, we describe our design of various static and dynamic data structure constructs, a visual formalism to describe data types and a visual representation of manipulations of data structures.
Many coarse-grain visual languages that are based on the data-flow paradigm are tailored to a specific domain (image manipulation, for instance), and only allow the use of pre-defined data structure types. In such cases, it is usually unnecessary to provide the programmers with language features that would allow them to build their own data structures.
On the other hand, fine-grain visual languages based on the data-flow paradigm are more likely to give the opportunity for the programmers to build data structures of their own. There are basically three approaches for doing so.
The first, illustrated by languages like Prograph [12], takes a procedural approach to building data structures: the programmer starts with empty objects and then has to produce a sequence of instructions that will add data to the objects; the reader of the program thus has to follow the sequence of instructions to figure out the details of the data structures used. In this kind of approach, there is no visual representation of the details of the data structures created by the programmer.
The second, illustrated by spreadsheet and form-based systems, focuses on displaying data sets. In this regard, form-based systems are more advanced than regular spreadsheets, as they allow grouping related data in separate forms, thus providing a visible structure that helps to understand how the data is structured.
The third, illustrated by the present paper, takes, as does the second approach, a more declarative stance based on strong typing: the programmer starts by declaring data types and then can use these types to specify what data comes in and out of activity nodes. In our case, not only is the data type representation done visually, but many basic data manipulations are represented visually as well.
We should distinguish here between visual representation of concrete data, where the description directly shows the organization of this actual data, and visual representation of data structure types, where the description shows how, at another stage, actual data can be organized.
In the former category, we can include data structure visualization systems such as those described in [1, 4, and 11]. These systems are usually tightly coupled with a regular text-based programming language and are used at execution time to allow the user to examine and explore the current values found in the various data structures of the program. Some of these systems have a fixed representation for every data construct [1], while others allow the user to chose between a variety of display methods [4]. These systems usually offer low-level support for dynamic data structures based on the concept of pointers.
Also in the first category, we can find regular spreadsheets that allow the construction of 0, 1 or 2 dimensional arrays, depending on the number and geometry of the cells that are used to hold the data. One cannot however really talk about data structures in this case, as such systems don't really enforce a correspondence between the calculations that are represented in formulas and the presence of actual data of the correct type in the cells involved in a calculation.
Some form-based languages also fit in this first category. Languages such as Formulate [10, 13] support arrays with a sophisticated user interface allowing the definition of regions and specific computations over these regions. However, such approaches don't seem to allow for a wide variety of data structures, nor do they seem to provide strong typing mechanisms through which the system could check that valid data is used in the computations. Both regular spreadsheets and this category of form-based languages usually don't offer any support for dynamic data structures, with the exception that the calculations can be defined in such a way that they can cope with changes in the size of the data they operate on.
Other form-based languages already fall in the second category. For instance, Forms/3 supports the concept of data types [2, 3], even though there is not a clear distinction between type declarations and type instances (implicit typing). This means that complex type definitions have to follow a bottom-up approach, or else the inclusion of a type in the definition of another type cannot occur. Forms/3 doesn't use visual representation of simple data types, as such types are implicitly defined the first time a value is associated to a cell. Another characteristic of Forms/3 is that most references within a form to components of other forms are done by direct user manipulation, which means that there is no long lasting visual representation of the links between the references and the original components, i.e. the manipulation that lead from each original component to its reference in another form. The main complex type construction mechanism in Forms/3 is the "abstraction box" that can be used within visual abstract data type forms. An abstraction box is a collection of cells that are placed within a bounding box and can thus be considered as representing a heterogeneous structure. Finally, in Forms/3, dynamic structures are built using matrices with dynamically calculated dimensions; primitive operations are provided to support manipulations on these matrices, but these operations are hidden in formulas associated with certain cells.
In the MAP programming environment [5, 6], a rather simple representation for data structures is available, that consists of grouping data elements in a bounding box. However, it doesn't seem to include any typing mechanism, nor a visual representation of sub-structure selection.
The DIVA system is a software development environment based on a semi-formal visual specification language. It aims at bridging the gap between the "clients" of an application and its developers. Because of this, we have focused on the detailed design phase supported by a visual formalism, with automatic code generation to produce code in a choice of various general-purpose programming languages (for platform independence). The environment includes various specialized editors that support combined data-flow and control-flow, as well as data type descriptions and data structure instances.
DIVA has evolved from an older system named IDEAL [7, 8] that was intended for the development of computer-based learning material and that only supported a control-flow formalism. DIVA adds to this initial environment data-flow description capabilities. To support data-flow, we introduced data description capabilities based on strong typing. Also, because of the clear separation between the specification phase and the coding phase, it is important to have a way to represent visually data selection and manipulation. For instance, it is not enough that designers have a way to designate data components via direct manipulation, since the programmers who read the specification will need to have a visual representation of what has been designated. Since at specification time no actual run-time object exists, we needed a way to describe abstractly how run-time actual objects (represented by variables and parameters) could be manipulated. For this reason, whatever manipulation is required to select a data component, the resulting selection can be represented by a static visual decsription that can be read later on, possibly by somebody else than its author, to figure out what has been selected.
To reconcile control- and data-flows in the same diagram, we have devised a graph representation where activity nodes are connected with edges along which data and control tokens can "travel." Control tokens have no internal representation and travel along control-flow edges, while data tokens have a type describing their structure, and travel along data-flow edges.
In the current implementation, the control-flow view and the data-flow view are not visible simultaneously. The user can switch at will from one to the other. During the switch, the nodes remain in place and control-flow edges get replaced with data-flow edges or vice-versa.
For the data flow, activity nodes have input and output terminals with statically defined types, each corresponding to an input or output parameter, respectively. The type of data token that can travel along a data-flow edge depends on both the type of the output terminal at which the edge originates and the type of the input terminal at which the edge ends. This aspect will be further discussed in section 7.
It should however be noted that data types are not directly visible in the data-flow representation. Whenever the user presses the left mouse button over an input or output terminal, a transient window pops up showing the graphical representation of the data type associated with the terminal. This helps to avoid cluttering the data-flow representation with all the data type representations.
Static data types include both simple data types (like boolean, integer, real, interval of integers, characters and strings), and structured data types (like arrays and records).
We tried to choose a visual representation for base types that would be easy to understand and remember (see Figure 1). We chose a question mark for boolean, because its true/false nature can remind one of a question. We chose the number sign for integers as this sign is often associated with the notion of a numerical value, even outside the computer science world. Reals are represented by two number signs separated by a decimal point (in some cultures, another character is used as a decimal separator, but the decimal point is probably still very widely understood). Intervals of integers are represented with a number sign followed by a subscript and a superscript numerical value; the subscript represents the lower bound of the interval, and the superscript represents the upper bound. Characters are represented with a small rectangle, evocative of the shape of the cursor often displayed for character input. Finally, strings are represented as a wider rectangle with an optional value inside it indicating a possible maximum length.
At a first glance, the visual representation may seem not to bring any improvement, compared with a textual representation. But the visual representation it is not language dependent. The textual representation may seem very natural and intuitive to English speakers, but non-anglophones don't have the same bias.
To represent arrays, we chose to evoke the concept of a deck of cards (Figure 2), with the base type of the array elements showing on the topmost card (this base type can either be a simple type as described in Figure 1, or the name or the icon of a user-defined data type). The range of valid indices for the array is indicated by a value beside the bottom right corner of the first and the last card. A name and/or an icon can be associated with an array structure, close to its upper left corner, to represent the data type thus defined.

Figure 2: Homogeneous structures
Record types are represented as rectangular boxes divided into "slots," each containing a component of the record (Figure 3). Each slot can, optionally, bear a name to its left, representing the name of that record field. Inside each slot is represented the type of the record field. As for arrays, this type can be either a simple type or a structured type other than the record type being defined. A name and/or an icon can be associated with a record structure, close to its upper left corner, to represent the data type thus defined (Figures 4 and 5).
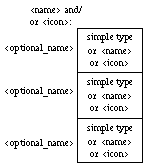
Figure 3: Heterogeneous structures (the number of slots is, of course, not
limited to three)

Figure 4: Record representing cursor coordinates: on the left, the icon
representing the data structure type, and on the right, the details of the
structure (a record with two integers).

Figure 5: Record representing an email data structure. Both "Header" and "Body"
are defined in separate declarations.
Many problems require the use of data structures with run-time adjustable cardinality. A programming language that supports dynamic structures does it either by offering language constructs to explicitly handle memory allocation, like with pointers in Pascal, or by offering one or more pre-defined dynamic data types along with other constructs to manipulate these pre-defined types. The latter solution is usually easier to deal with, from the programmer's point of view, and thus seems more appropriate for visual languages. In our case, we chose to offer both tree and list structures, in spite of the fact that it is usually possible to define one based on the other, because that is usually done at the expense of readability and ease of use.
All forms of trees are represented in the same way, as shown in figure 6. When defining a new tree type, the programmer has to specify the type of data contained in each node, the degree of the tree, and the name or icon representing the newly created type.

Figure 6: Tree structure types
Lists have a representation that is very similar to arrays, except for the last "solid line" card and the indices that have been removed to show that the elements are not limited in number (Figure 7).

Figure 7: List structure types
The main reason that motivated our choice of a representation for lists that bears a lot of resemblance with the representation for arrays is that both are ordered sequences of elements. Lists are often used for unbounded arrays. Of course, a major difference is that list elements can be sub-lists, but we did not find a good way to represent that visually.
In a fine-grain visual language, data structures are not necessarily used as a whole everywhere they are needed. We therefore devised a way to describe how part of a structure could be extracted without relying on the actual contents of the structure. Figures 8 to 12 show how item selectors are displayed. Here again, we should point out that the visual representation of these selection operations do not appear directly on the static representation of the graph, so as not to clutter the display too much. Instead, they appear on demand, in transient windows, whenever the user click on the head or the tail of a data-flow edge where these operations occur.
The selection of an element in an array is shown in a way very similar to the representation of an array type, except that the card represented with a dotted line sticks out of the deck and bears the value of the index selected (Figure 8). This assumes, of course, that the value of the index is known at the time the program is written.

Figure 8: Selection of an element in an array with a constant index (the base
type of the array has been omitted, as it is not relevant here).
If the index to be used for the selection of an item in an array is found in a simple numerical variable, the representation of the selection is slightly different from Figure 8. The numerical object used as index is thus shown with an arrow pointing at the selected element (Figure 9).

Figure 9: Selection of an element in an array with the value of a numerical
object (that is used as an index to the array).
For a record structure, the selection of a field is shown simply by highlighting the corresponding "slot" in the record representation (Figure 10).

Figure 10: Selection of a field in a heterogeneous structure.
By combining the mechanisms shown in Figures 9 and 10, we can see how a numerical field used to select an array element can be represented (Figure 11).

Figure 11: Selection of an element in an array with a numerical item of another
structure.
Similarly, if a record field is itself a sub-structure that contains other sub-structures, the selection of the deepest element is shown by highlighting the appropriate field of the main record, with the corresponding sub-structure showing beside it. Again, the appropriate field of the intermediate structure is shown highlighted with the corresponding sub-structure shown beside it with its appropriate field highlighted (Figure 12 and Figure 13).

Figure 12: Selection of an element of an item in a sub-substructure.

Figure 13: Selection of an element in an array that is a field of a record.
By combining the mechanisms shown in Figures 11 and 12, we see how an element of a sub-structure can be used as an index to select an element in an array (Figure 14).

Figure 14: Selection of an element in an array with a numerical item in a
sub-substructure.
Similarly, for an array of records, Figure 15 illustrates how a field in a specific array element can be selected.
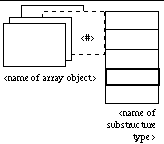
Figure 15: Selection of a field in an element of an array of structures.
Figure 16 illustrates selection in a multi-dimensional array.
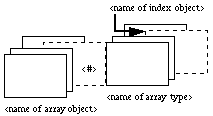
Figure 16: Selection of an element in a two-dimensional array. In this case, the
first index is a constant and the second a variable.
In our data-flow formalism, as in other data-flow formalisms (e.g. Fabrik [9]), activity nodes are connected to each other with data-flow edges that are "hooked" to little terminals representing the input and output parameters of the activity nodes. In our case, each such terminal has a data type associated with it. When an output terminal of a source node is connected to an input terminal of a destination node with a data-flow edge, the strong typing normally requires that the types of the source and destination terminals coincide.
However, since only part of a data structure produced by a node may be useful to another node, the selection mechanism described in section 6 can be used to select the exact structure element in the source data structure that is needed by the destination node.
Similarly, the data sent through a data-flow edge might only be part of the data structure associated with the destination terminal. In this latter case, a selection on the destination type is used to indicate where the data should arrive. It is thus assumed that the destination data structure will be composed of bits and pieces coming through various data-flow edges.
To make it easier for the programmer to locate data selection and composition along data-flow edges, the head and the tail of the arrow representing an edge can have different shapes, based on whether selection and/or composition are taking place. As it is illustrated in Figure 17, the arrow head is shown as a triangle if composition is taking place at the destination terminal, otherwise it is composed of two segments forming an obtuse angle, and the arrow tail is shown with three segments if selection is taking place at the source terminal, otherwise it is a simple line.

Figure 17: Representation, on edges, of selection and composition.
By clicking on an arrow head representing composition or an arrow tail representing selection, the user can make a pop-up window appear that will show the data structure of the data token, with a visual representation of the composition or selection operation respectively.
Figures 18 and 19 below illustrate how the control-flow and the data-flow views of the same set of nodes are complementary. As we mentioned in section 3, the user can switch at will from one to the other. All nodes remain in place during the switch, only control-flow edges get replaced with data-flow edges and vice-versa. For sake of readability, we have kept the two views separate rather than superimposed, but we are considering allowing the user to ask for a superimposed view. In that case, color would be used to differentiate the two kinds of edges.
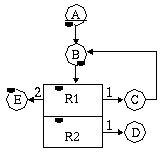
Figure 18: Control-flow view of a diagram.
The semantics associated with the control-flow view of Figure 18 are the following: a control token gets passed from one node to the next, along one of the edges, as soon as the execution of the current node is terminated. The first node to be executed is designated with an underline (node A, here). For nodes with multiple successors, the token is passed through one of the edges, based on both how many times the originating node has been executed and on the edge labels. As soon as a node gets the control token, it can start executing.
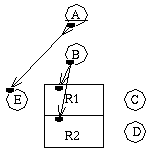
Figure 19: Data-flow view of the same diagram as Figure 18.
The semantics associated with the data-flow view of Figure 19 are the following: part of a data token produced by node A will be used by node E, when that node gets executed. A data token produced by node B will be used in both nodes R1 and R2, when they get executed. When a node has at least one control-flow predecessor, its execution is triggered by the reception of a control token. When a node has only data-flow predecessors, its execution is triggered by the availability of data tokens on all its incoming edges. More details about the execution model underlying this mixed control- and data-flow formalism go beyond the scope of this paper, and will be the subject of a future article.
For the moment, we haven't devised any visual representation for the selection and composition operations on dynamic structures. While it is quite easy to figure out what should happen with selection and/or construction over static structures, it is less obvious for dynamic structures like trees and lists. Indeed, because of its dynamic nature, it is not straightforward to specify the location of an element in a tree or a list, unless it is based on some property of that element, from which its location can be inferred (e.g. the key of an element in a sort tree allows one to locate the element without knowing in advance the "shape" of the sort tree).
There are however operations that are rather common for dynamic structures, for instance:
It is our intent to design visual representation for at least some of them.
We have shown, in this paper, how various static and dynamic data structure constructs could be represented visually, allowing strong typing in a combined control- and data-flow formalism. We have also shown that basic data manipulations that didn't require computations could also be represented visually, in transient windows, combined with visual hints on the data-flow edges. We do not yet have experimental evidence that this approach is easier for programmers than a purely text-based representation, but it offers an alternative that should be easier to comprehend for people without a programming background.
Site Hosting: Bronco