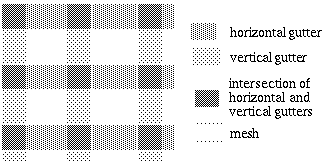
Fig. 1: Display area subdivision.
One major challenge with graph-based visual languages is managing the complexity and maintaining a good readability as the density of edges in the graph increases. To improve the graph readability we propose a solution that manages the visual complexity of graph-based diagrams with many hundreds, and even thousands of nodes. It consists in applying heuristics to choose the best path for an edge and attributing to it a color defined automatically according to its origin and destination nodes. A grid system where certain areas are reserved for the display of nodes and others for the edges, is used for the layout of the nodes and edges.
Keywords
graph, incremental layout, orthogonal drawing, readability, visual language.
Some elements of the work described herein have been detailed in earlier papers: in [1] an outline of the drawing algorithm we developed, and in [2] a comparison of various graph-drawing approaches that tackle this problem. We will therefore limit the description in this paper to aspects that have not been published yet. The reader is strongly advised to read these two earlier papers to better understand what is described hereafter.
The graphical presentation of the diagram is organized on an underlying grid. The grid is composed of a number of alternating meshes and gutters (Fig. 1). Gutters contain edges and meshes contain nodes. Gutters are each subdivided into nine longitudinal channels and one transversal channel. Each channel can be occupied by only one edge. Edges can thus run vertically in vertical gutters, horizontally in horizontal gutters and can change direction at gutter intersections (rotation of 90 or 270 degrees) as shown in Fig. 2, where two edges change direction. A short straight edge connecting two physically adjacent nodes can also run horizontally across the middle of a vertical gutter or vertically across the middle of a horizontal gutter (in Fig. 2, a vertical straight edge arrives on the node and a horizontal straight edge leaves the node)

Fig. 1: Display area subdivision.
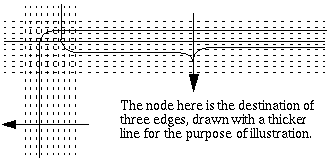
Fig. 2: Gutters are subdivided into channels.
Our drawing algorithm automatically finds a trajectory for every edge of the graph. In a first version, edges were strictly limited to gutters, and channels were allocated in sequence, leading to unnecessary edge crossings (see Fig. 5) and edges running unnecessarily close to each other (see Fig. 6). To improve the readability, we considered mesh edges (edges that cross empty meshes) and combination edges (that use both gutters and empty meshes) as shown in Fig. 3. Heuristic rules, such as the one symbolized by Fig. 4, are used to automatically select edge paths that result in fewer bends and increased space between edges, considerably improving the overall graph readability (see Fig. 7).
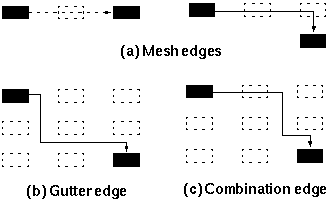
Fig. 3: Three types of edges. In the old algorithm
only gutter edges are used (b).
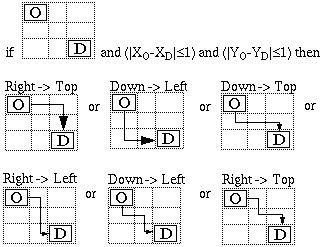
Fig. 4: Typical rule. The words "Right," "Left,"
"Down" and "Top" refer to the side of the node to
which the edge is connected

Fig. 5: (a) shows unnecessary edge crossings
that the channel allocation mechanism tries to
avoid. (b) shows the result.
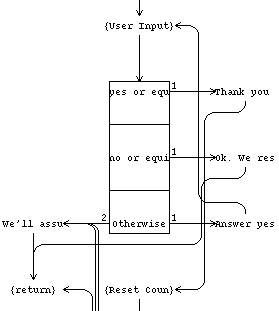
Fig. 6: Partial view of the display of a graph with
the initial algorithm.
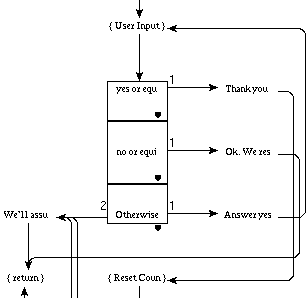
Fig. 7: View of the same portion of graph as in Fig.
6, rendered with the enhanced algorithm.
To make it even easier for the user to follow the path of each edge, the rendering algorithm has been modified to automatically allocate a different color to each edge, based on its origin node for the hue, and on its destination node for the intensity and the saturation.
Site Hosting: Bronco