(a) 
| |
(b) 
| (c) 
|
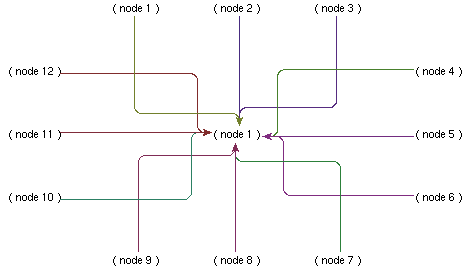
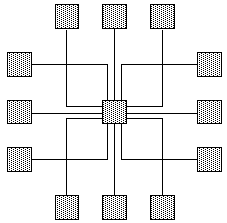
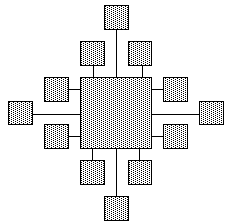
Fig. 1: Three drawings of the "star graph," (a) is produced by our system, (b) is in the Kandinsky model and (c) is in Biedl's et al. TSS (limited growth) model
In a project where we combine control- and data-flow [10], we are thus faced with the problem of automating the drawing process (deciding node placement and edge trajectory) as much as possible without reducing the usability of the interactive tool. This implies that nodes cannot be moved around automatically by the editor, and that the edges connecting the various nodes should not overlap with the nodes themselves, so as not to interfere with the readability of the node contents.
Initially, the research in orthogonal grid drawing was mainly motivated by VLSI design. It has also been used for entity-relationship diagrams [13] and data-flow diagrams [1]. In all these cases, the research has mostly focused on the aspects of complexity and minimization of area and number of bends rather than the readability and usability for an interactive user [5][12]. Of course, one could argue that minimizing the number of bends of the edges of a graph should improve the overall readability of the graph, but this remains to be proven.
The authors of [3] categorize orthogonal high degree graph drawing into three main models: (1) an unlimited-growth model, such as visibility representations, where nodes are enlarged as much as necessary to allow all the edges to be straight lines, (2) planar orthogonal drawings with equal vertex size, also known as the Kandinsky model, where all nodes have the same square size, and (3) an limited-growth model, where the size of a node is proportional to its degree (number of edges connecting it to other nodes), that is, the node is as large as it needs to be to accommodate the incident edges. All these approaches require that edges be completely independent from each other, requiring that they all use different ports to connect to graph nodes. These approaches also assume that all the edges connected to a new node are known when the new node is inserted, and that the insertion of a new node usually implies having to move many other nodes to "make room" for the edges connecting this new node to existing nodes.
Given that our graphical editor was meant to be used to build specification graphs from scratch during brainstorming sessions [9], we considered that having a complete rearrangement of the graph layout at each step of the editing would unacceptably disrupt the editing process. Even a sporadic rearrangement of nodes was rejected as unacceptable if it was not absolutely necessary. Moreover, since edges are added to the graph one after the other, the routing of all the existing edges should not be affected by the insertion of a new edge. Another particularity of our situation is that nodes have a textual content that occupies a fair amount of space, and that needs to be at least partially visible at all times to allow the user to make sense of the graph that is displayed. The grid step for nodes is therefore much larger than for edges. All these considerations led us to clearly separate the areas where edges can flow (gutters) from the areas used by the nodes (meshes). Multiple edges can run in the same gutter. To avoid overlaps, gutters are subdivided into channels in which only a single edge can run. In some ways, this is similar to the use of gutters in VLSI design to allow the flow of edges connecting elements that are far apart from each other [15]. When no node occupies it, a mesh may be traversed by a vertical and/or a horizontal edge. In addition, we allow for edges with the same destination node to meet at their destination, on the same port, thus not requiring the node to be enlarged to accommodate many edges connecting to it. Edge intersections are not meaningful, that is, their presence doesn't mean that the edges are merging. The only place where edges may merge is where they reach their destination node, just before the arrowhead. Heuristics are used to select the gutters and the channels for edges so as to minimize intersections and bends. We also use rounded bends rather than the simple right angle bends found in most graph drawing systems to increase the visual contrast between an actual bend at the intersection of two segments of the same edge and the accidental intersection of two different edges. To our knowledge these various aspects of our approach have never been considered before, probably because the constraints we put on our system were never considered as imperative by the graph drawing community.
Nevertheless, if we want to compare our approach [11] with the other incremental orthogonal graph drawing approaches (see Fig. 1), we can say that our approach resembles the Kandinsky model (planar orthogonal drawings with equal vertex size), except that we consider nodes of rectangular shape, that we do not consider moving nodes apart to make room for newly inserted edges, that nodes can be placed arbitrarily by the user and that we let edges meet at their destination, on the same port. In some ways, our using multiple "channels" in the gutter areas, plus our connecting edges with the same destination on the same port advantageously replaces the more traditional techniques of moving nodes aside to make room for edges and enlarging nodes to allow for more edge connections.
(a) 
| |
(b) 
| (c) 
|
Fig. 1: Three drawings of the "star graph," (a) is produced by our system, (b) is in the Kandinsky model and (c) is in Biedl's et al. TSS (limited growth) model
Site Hosting: Bronco