 VP-SE Research Group (C)
The domain of educational application of the computer has also been very influenced by this trend. Almost every courseware application makes nowadays extensive use of color, line and raster graphics. This graphical component makes these applications more appealing to the user. However, in order for such applications to be fast enough to run on low-end machines, most implementors sacrifice portability in favor of speed. A vast majority of courseware applications are thus highly non-portable, mainly those using color and raster graphics.
Another trend that has also influenced educational applications is software CAD (Computer Aided Design). Software CAD is an emerging paradigm of these very last years (Smith86, Buhr89). It refers to automated software design techniques centered around wiring-diagram-like graphical representation of software, with a supporting environment that allows for automatic program generation and fast prototyping. Graphical programming (or visual programming) (Chang89, Jacob85, Glin84, Brown85, Raed85) is generally seen as the combination of software CAD and automatic programming (Fren85, Bars85, Balz85).
The rest of this document will mainly discuss, as a case study, two developments done at the computer science department of the university of Geneva. These two developments relate to the two trends mentioned above and show solutions that are not necessarily specific to educational software.
These graphical representations generally exist at different levels of abstraction. Usually, the closer one gets to the actual implementation of a solution, the more formal the representation is. Computer science, like other sciences (even though some consider it as an art), has its own graphical representations (Tripp88, Raed85):
In our research group on computer assisted learning, we use a graphical specification formalism developed by Prof. A. Bork's team (Bork86) at the University of California, Irvine. Albeit simple, this formalism allows a complete and detailed description of a lesson (partially in natural language) of a lesson. Similarly to a movie script, but less linearly, the dialogue between the computer and the learner can be described, specifying the text that has to be output (messages), actions that have to be done (instructions to the coder) and the sequencing of operations corresponding to the user's answers or actions.
The basic idea of the project we'll describe hereafter is to have a whole set of computer utilities based on this graphical representation to tackle the whole life cycle of a CAL program. The experience we acquired in the development of various CAL lessons allowed us to better define the tools needed in connection with the use of a general purpose programming language. These tool are, as a matter of fact, quite similar to those of any large scale project: specification tools, implementation tools, prototyping tools and maintenance tools.
In order not to impose any limitation on the teachers who want to develop CAL lessons, we use a two phase approach in which the teachers specify the behavior of a lesson in a detailed script (pedagogical design phase) and then a team of coders implement this script using a general purpose programming language (coding phase).
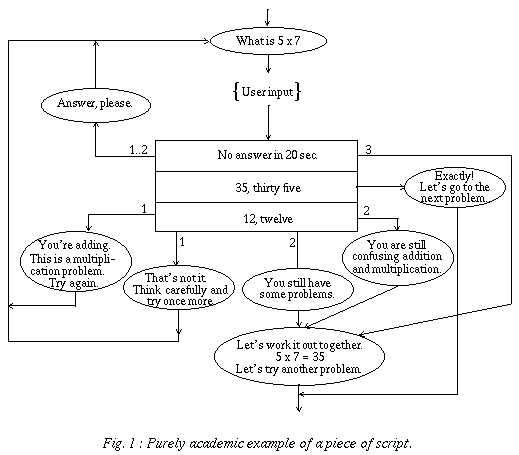
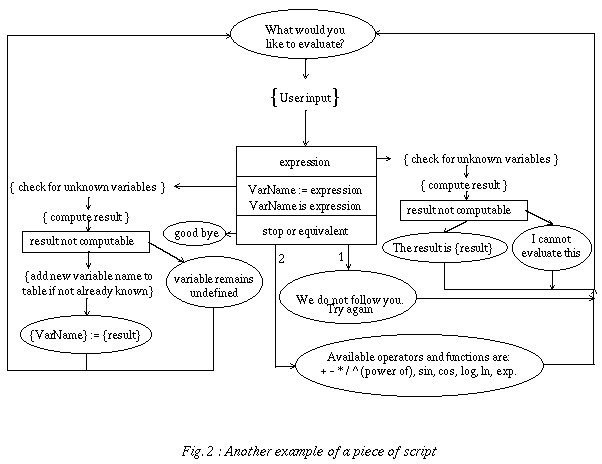
It is built on just three basic elements: text that has to appear on the screen, instructions to the coder (in natural language) and predicates (generally corresponding to answer analysis criteria). The flow of control is represented by arrows connecting the different elements. The specification of a lesson can thus be represented as a directed graph, in which each node corresponds to one of the three basic elements and where the edges indicate the sequence of operations (Figures 1 and 2). Text to be displayed is written in an ellipse, instructions to the coder are between curly brackets and predicates are inside rectangular boxes.


Complementary predicates can be put in sequence (like IF THEN ELSIF instructions). If the criterion is satisfied, an edge on the side is followed; if it isn't satisfied, the criterion just below (if present) is then evaluated, and so on. If none of the criteria apply to the user input, the edges originating from the bottom of the last box indicate the actions to be taken in such an unanticipated case. Generally, the teachers and pedagogues who participate to the pedagogical design find no difficulty in mastering this rather simple formalism. As it is, this formalism is only semi-formal since it includes unformalized components, i.e. the instructions to the coder and the test box predicates.
Looking at the example of Figure 1, one can see that various analysis criteria of the learner's answer are specified in a sequence of adjacent test boxes. Three cases are anticipated here: the learner doesn't answer, the learner gives the correct answer and the learner confuses addition and multiplication. The way the script is specified, the learner can never fall into an infinite loop and he usually gets a different feedback for each of his tries.
For those cases in which the graphical language is not powerful enough to fully specify the behavior of an application, a conventional programming language is generally used in complement. Part of the specification of the application can then be written using this programming language, most probably in a textual form. Such a code segment could be visualized as a specific kind of icon in the graphical specification.
If the graphical language is interpreted, it makes a lot of sense to choose an interpreted conventional programming language to go with it. The interpreter for the conventional programming language would then have to be integrated to the graphical interpreter to allow the latter to invoke the former for a code segment item of the graphical specification. An easy solution is to write the graphical interpreter with the same interpreted programming language as the code segments. The graphical interpreter then just needs to pass to the programming language interpreter the text associated with an icon representing a code segment. For example, one could write the graphical interpreter in LISP and have LISP also used for the code segments of the application.
If the graphical language is compiled (i.e. translated into source code for a conventional programming language), it seems better to use a modular target programming language. This way, the code needed to complement the graphical specification of the application could be given in separate modules and compiled separately from the automatically generated code. This solution is more flexible than using a graphical interpreter since the programming language for the graphical compiler need not be the same as the programming language used on the target machine. The compiler can even be table driven in order to generate source code in different target languages, allowing the developers to adapt to whatever programming language is available on a target machine.
In our case, the specification language being only partially formal, we absolutely need to have conventional programming capabilities in addition to the graphical language. Since we didn't want to be tied to interpreted languages and since we already had an adequate run-time environment written in UCSD Pascal on many different target machines, we have decided to go for the second approach. Our graphical compiler is however not limited to generating code in UCSD Pascal. It can in fact already produce code in a few other languages.
The lessons to be developed with this environment are intended to run on personal computers and need far fewer computing resources than the development environment itself, typically 640 KBytes of memory and a monochrome 12" graphic screen. The target programming language (the language in which the courseware itself is written) need not be the same as the one chosen to write the environment tools. In fact, the environment is table driven and can generate, among other target languages, Ada, Modula 2, UCSD Pascal, or Turbo Pascal programs.
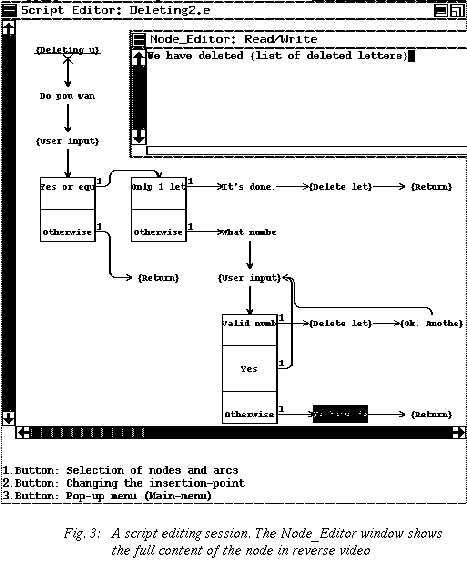
Since graphical specifications tend to produce relatively large documents, the script editor clips the content of each node to its first few characters for a better overall view. It can thus show larger chunks of the specification on the limited space offered by the screen (Figure 3). The designers can very easily see the full content of a node by "double clicking" on it. On the other hand, there is, of course, a hardcopy utility that can plot the whole graph with the full content of its nodes on large sheets of paper.

Graphics that have to be incorporated in a lesson are generally described with a few words in an instruction to the coder, e.g. { picture of a plane taking off }. In a later stage we intend to incorporate to the script editor some sketching facilities that would allow the designers to make a approximate drawing of the desired picture. There are so many graphic editors on the market that there is no point in incorporating a full graphic editor to our script editor. We prefer to make reference in the script to images that are prepared externally with more appropriate tools.
The code that the programmer(s) has to add is thus isolated in modules that are separate from the code produced by the automatic program generator (i.e. the script compiler). These external modules have their definition (interface) produced by the automatic program generator and the coder(s) can use the synchronous multi-window editor to specify their implementation.
Any script window can be synchronized with a module window or vice-versa. The script window is read-only in the sense that one can only issue positioning commands in it. One can enter positioning commands in any of the windows and ask for the other window to "synchronize", i.e. show the corresponding part of the view it handles. The programmer can thus very easily see, write or modify the code corresponding to a specific part of the script by finding the location in the script window and then asking for the module window to synchronize, i.e. show the code for that part of the script. One can also find a specific location in the code (e.g. where an error occurred) and then ask for the script window to synchronize, i.e. show the part of the script that is the specification of the code.
One can have more than one pair of script-program windows at the same time. With this tool the programmer can always see the graphical specification at the same time as the code he is working on. This specification (the script) should help him understand and manage the code since it can be seen as a human readable documentation of the code.
When a lesson is running on a target machine, one can use a development workstation to listen to the network and visually follow on the workstation screen the progress of the lesson by highlighting directly on the script the node that is currently being executed. In parallel to showing on the screen the progress of a lesson, it is possible to use the same technique to automatically collect statistics on the progress of the different lessons.
In addition to its obvious utility in the operational phase of the CBL material, this possibility of watching a lesson run on a target machine is very useful for the debugging of the code during the coding phase. Indeed, it allows the programmer to know exactly where in the script one was when a lesson "crashed". The synchronous editor can then be used quickly to find the corresponding code, making it much easier to locate and correct coding errors.
With the microcomputer architectures that are commonly available, it is much too time consuming to do in real-time all the adjustments of a raster image to the specific characteristics of a screen. Raster graphics are nevertheless desirable in order to make CAL material more attractive to learners.
Some windowing systems, like NeWS (based on a PostScript engine), try to bring a solution to this problem, but such systems are acceptable only on powerful graphical workstations with high resolution screens. On a low-end microcomputer, scaling a raster image is time consuming and the low resolution screens make the rounding errors of the scaling process much more noticeable. A human intervention is generally needed to choose the best scaling algorithm (dithering, triggering, ...) and to make the few alterations that will give the scaled image its best appearance.
This means that the image has to be prepared in advance in order to be displayed without any further transformation. That is, the process of adapting an image to a specific hardware must be kept separate from the process of displaying the image during the execution of the CAL program. Furthermore, if a compression algorithm has been used to store the image on disk, loading the image from the disk should be separate from displaying it. Also, for machine independence, the CAL program should not have to specify screen coordinates for the window and the place in the window where the image is to be displayed.
In addition, CAL applications often need to intimately intertwine raster images and vector graphics, for instance to draw an arrow at some specific point of an image or to put a frame around some detail. There again, the program should not have to specify any pixel coordinate to draw line segments, otherwise this program would have to be modified for each new screen resolution.
The CAL programmer should not have to deal with screen coordinates, pixels or anything related to the hardware. To achieve this, image files start with a header that describes the whole image file. The header contains information like the number of images present in the file, their sizes, their number of planes (or bits per pixel), the number of reference points (described in next paragraph) of each image and their position. The pixmaps (raster images) per se are stored in any format convenient for the target machine (GIF, TIFF, PBM, compressed or not, ...). Image files are device dependent but the tools we provide allow transformation from those files specific to one device to those specific to another device. It is with the information available in the header that the underlying raster graphic tools can handle the images without needing any further information from the programs using them.
Reference points are referred to by a number. They are stored in the header of an image file during the development phase by the designer of the lesson. The designer uses an interactive tool that let him directly point to the image and add reference points one after the other. Adding reference points to an image can also be done from a program if there is any need to do so.
To illustrate the use of reference points, let's take the example of a language lesson. Let's assume that the designer wants to show a face and ask the student to position the cursor on some specific part. The designer could then put a few reference points around this part and ask the programmer to build a routine that will check that the cursor is inside the polygon delimited by these points. Another solution would be to put a reference point at the center of the part and another one at its farthest point. One could then check that the cursor is inside the circle delimited by these two points. If the student doesn't give the correct answer, the program can, for instance, blink an arrow that points to the correct place by using one of these same reference points.
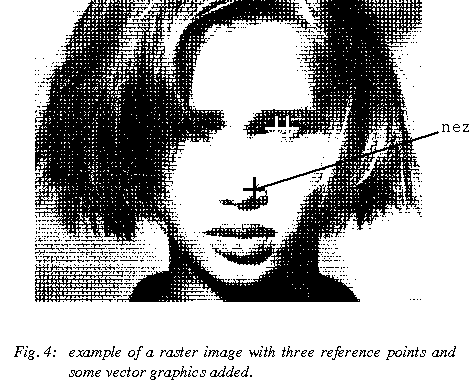
For the program to work correctly, one simply has to use the image editing tool we provide to place interactively the reference points needed. For instance, in Figure 4, the two reference points in the eye area enable the program to check if the student has placed the cursor on the eye, and the reference point on the nose allows the program to draw an arrow connecting a text to a part of the image. These reference points are visible when the designer interactively places them, but are invisible when the image is actually displayed during the lesson. The cursor positions and the reference points are all given in world coordinates, so there is no problem in comparing them.

It is mainly for speed and because images tend to get used multiple times in the same program and even displayed in different places on screen that the operation of getting an image from disk is kept separate from the actual operation of displaying it. This raises the problem of ensuring that the two operations are done in the correct sequence. A feature is provided to automatically test that an image variable contains a valid information so that a CAL program cannot ask to display an image on screen before fetching it from disk. If ever it happened that the programmer forgot to load an image before trying to display it, an appropriate error message would be displayed.
As one may have noticed, nothing has been said for the moment about the pixmap structure. It is because that structure is highly dependent on the screen characteristics and, for that reason should not be dealt with by the application programmer. This enables the same program to manipulate a monochrome version of an image on a machine that has a monochrome screen and a color version of that same image on a machine that has a color display. The developer simply has to prepare a specific image file for each version. By using one of the interactive tools we provide, he/she can in fact very easily derive the monochrome version from the color (or grey level) one.
For images that would be computed rather than interactively created, there is also a "pixmap filing" package that allows any application program to create an image file, store images and define reference points. The application programmer has two ways of using this package; either he/she declares an image variable and, knowing the internal structure of the raster information, directly accesses the content of that variable, or he/she can manage to draw the image on screen and then use the "SaveScreenImage" primitive.
For relatively small images (less then 256 pixels wide and not more than 16 colors or levels of grey) there is yet another way of creating images that we provide in our set of tools. It consists in creating a text file (i.e. with a standard text editor) in a specific format and providing this text file as input to a program that will use it to create the corresponding image file. Without giving too much detail about the format of these text files, we'll just say that images can be represented as matrices of characters where each character represents a pixel value as a hexadecimal digit. Each line of hexadecimal characters in the text file corresponds to a row of the raster image. This allows for grey level images as well as color ones. A monochrome image is simply considered as an image with two levels of grey.
The transformation utility we provide is heavily based on visual interactions. The developer can use this utility on the new machine to bring an image to the screen and try different combinations of bit or byte flipping until he/she sees on screen a coherent image. This will take care of any byte sex or other big versus little endian problem. For different screen resolutions, this same utility provides the user with a fractional scaling primitive, for instance to transform a 80x40 image into a 64x32 one. This operation also adapts the reference points to the new dimensions. If we return to the biology example mentioned earlier, adapting the CAL program to run on a different screen resolution would only imply that the person in charge of the adaptation uses the transformation tool to scale the images so that they have the same proportions when displayed on the new screen as they had when displayed on the old one. All the reference points are automatically adjusted accordingly.
To scale monochrome images, different choices are available, mainly dithering and triggering. Dithering is generally more adequate for realistic images that come from a digital scanner and triggering is generally better for simple images that have sharp edges. Once the choice has been made, the resulting image is shown on screen and the developer can either accept it or try another transformation on the original image. When the result is satisfactory enough, the developer can use another primitive to do some small editing in order to correct the rounding errors due to the scaling operation. The image will then be ready to be used by the CAL program to which it belongs.
Wherever already exists a graphical specification formalism, a set of tools based on this graphical representation can be built to help designers not only create specifications but also manage the whole life cycle of their software.
We have also demonstrated that, even though raster graphics demand significantly more computing power than vector graphics, this was not a reason to give up portability. Even if some of the operations we have described imply a human intervention and given that these operations need only be done once for each new equipment, the set of tools we have developed constitute a much needed alternative to the usual extensive code modifications required.
Site Hosting: Bronco